Lately I’ve been working with a dataset where I need to plot around 50,000 dense points, and the render time has been horrible. We’ve all downloaded electronic documents with plots like this. These files become almost unusable because (a) the file size is huge and (b) they hiccup whenever you scroll past one of the offending graphs. I don’t want my thesis to annoy people who use it!
One (lame) solution is to just save the entire figure as an image (png/jpg), but I don’t like this option because I want axes and annotations to be vector-quality. I’ll choose the huge file size over pixelated text.
Yesterday, though, I discovered a little hack in Python’s excellent Matplotlib
In Matplotlib, you can assign an attribute to any plot element called rasterized=True. It will convert only that graphical element to raster, while retaining everything else in the plot as vector. You also have fine control over the resolution (dpi) of the rasterized components.
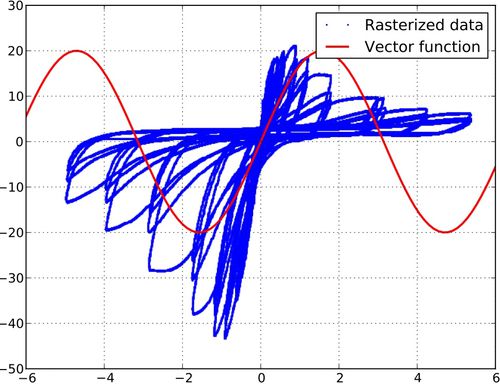
Here is an example. I am plotting the previously mentioned 50,000 point dataset as well as a sine function for comparison. I want to rasterize the xy-data but keep everything else (axes, gridlines, legend, the sine function) vector. You can run this example by downloading rasterize.py and xydata.txt below.

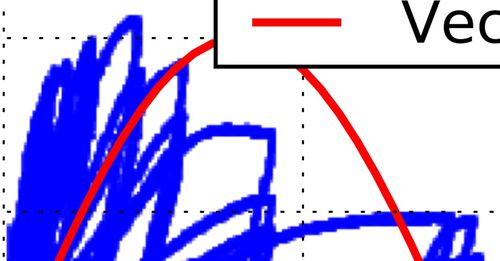
Closer inspection confirms that the blue dataset is raster, while the legend, red curve, and gridlines are vector:

You can really get a feel for the impact this makes on usability by comparing the pdf with rastering to the pdf without rastering. Try zooming in and out in each of these files–the difference is profound!
There are obvious trade-offs here. You are sacrificing the vector quality of the dense dataset for the sake of improved performance, but that’s a compromise I’m happy to make in this case.
Data scientists in the audience: Is there a better solution to this problem?
-
Python/Matplotlib: http://matplotlib.sourceforge.net/ ↩
-
StackOverflow: How to save figure to pdf as raster images in matplotlib ↩
-
Code to produce above figures:
rasterize.py,xydata.txt↩