I have written before about how to digitize a graph on a Mac. Numerical analysts regularly need to plot the response of numerical models against experimental results only accessible via plots embedded in pdf files. This applies not only to older raster documents, but also to vector-based pdf files. Until researchers begin making more data publicly available, this is a problem we have to contend with.
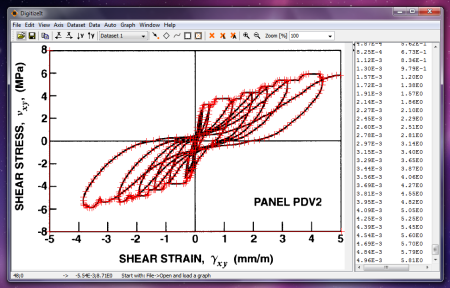
Since I spend a lot of time on a Windows box, it’s cumbersome to switch to the Mac just to digitize a plot. I searched for an effective tool, tried a few, and finally landed on DigitizeIt. While it weighs in at a hefty $49, after trying a few free options that munged the data pretty badly, I happily settled my misgivings about the price and got back to work. This tool just works. The screenshot above shows DigitizeIt working with some data from the Vecchio shear panel tests at the University of Toronto.
Like every other graph digitizer I’ve tried, this one offers an auto-detection algorithm that fails miserably when you have multiple overlapping curves. Resign yourself to the fact that this will be a manual process—head down and power through. I can digitize a graph like the one above in about 15 minutes.
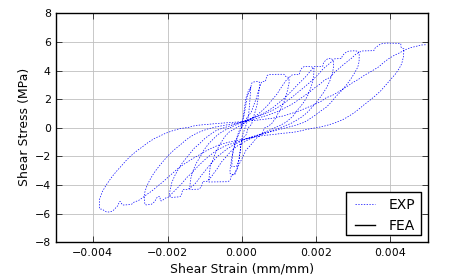
Data is exported in a no-frills csv file, simple enough to process with Python or Excel. Here’s the above data plotted in Matplotlib:
Again, it’s a somewhat expensive tool to scratch this itch, but I needed something that was intuitive and just worked. Oh, it’s also cross-platform (Win/Linux/OSX), although I can only vouch for the Windows version.